


Debugging
In-Practice/Debugging
Graphics programming can be a lot of fun, but it can also be a large source of frustration whenever something isn't rendering just right, or perhaps not even rendering at all! Seeing as most of what we do involves manipulating pixels, it can be difficult to figure out the cause of error whenever something doesn't work the way it's supposed to. Debugging these kinds of visual errors is different than what you're used to when debugging errors on the CPU. We have no console to output text to, no breakpoints to set on GLSL code, and no way of easily checking the state of GPU execution.
In this chapter we'll look into several techniques and tricks of debugging your OpenGL program. Debugging in OpenGL is not too difficult to do and getting a grasp of its techniques definitely pays out in the long run.
glGetError()
The moment you incorrectly use OpenGL (like configuring a buffer without first binding any) it will take notice and generate one or more user error flags behind the scenes. We can query these error flags using a function named
GLenum glGetError();
The moment
| Flag | Code | Description |
|---|---|---|
| GL_NO_ERROR | 0 | No user error reported since the last call to |
| GL_INVALID_ENUM | 1280 | Set when an enumeration parameter is not legal. |
| GL_INVALID_VALUE | 1281 | Set when a value parameter is not legal. |
| GL_INVALID_OPERATION | 1282 | Set when the state for a command is not legal for its given parameters. |
| GL_STACK_OVERFLOW | 1283 | Set when a stack pushing operation causes a stack overflow. |
| GL_STACK_UNDERFLOW | 1284 | Set when a stack popping operation occurs while the stack is at its lowest point. |
| GL_OUT_OF_MEMORY | 1285 | Set when a memory allocation operation cannot allocate (enough) memory. |
| GL_INVALID_FRAMEBUFFER_OPERATION | 1286 | Set when reading or writing to a framebuffer that is not complete. |
Within OpenGL's function documentation you can always find the error codes a function generates the moment it is incorrectly used. For instance, if you take a look at the documentation of
The moment an error flag is set, no other error flags will be reported. Furthermore, the moment
glBindTexture (GL_TEXTURE_2D, tex);
std::cout << glGetError() << std::endl; // returns 0 (no error)
glTexImage2D (GL_TEXTURE_3D, 0, GL_RGB, 512, 512, 0, GL_RGB, GL_UNSIGNED_BYTE, data);
std::cout << glGetError() << std::endl; // returns 1280 (invalid enum)
glGenTextures (-5, textures);
std::cout << glGetError() << std::endl; // returns 1281 (invalid value)
std::cout << glGetError() << std::endl; // returns 0 (no error)
The great thing about
By default
GLenum glCheckError_(const char *file, int line)
{
    GLenum errorCode;
    while ((errorCode = glGetError()) != GL_NO_ERROR)
    {
        std::string error;
        switch (errorCode)
        {
            case GL_INVALID_ENUM:                  error = "INVALID_ENUM"; break;
            case GL_INVALID_VALUE:                 error = "INVALID_VALUE"; break;
            case GL_INVALID_OPERATION:             error = "INVALID_OPERATION"; break;
            case GL_STACK_OVERFLOW:                error = "STACK_OVERFLOW"; break;
            case GL_STACK_UNDERFLOW:               error = "STACK_UNDERFLOW"; break;
            case GL_OUT_OF_MEMORY:                 error = "OUT_OF_MEMORY"; break;
            case GL_INVALID_FRAMEBUFFER_OPERATION: error = "INVALID_FRAMEBUFFER_OPERATION"; break;
        }
        std::cout << error << " | " << file << " (" << line << ")" << std::endl;
    }
    return errorCode;
}
#define glCheckError() glCheckError_(__FILE__, __LINE__)
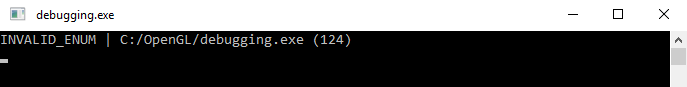
In case you're unaware of what the preprocessor directives __FILE__ and __LINE__ are: these variables get replaced during compile time with the respective file and line they were compiled in. If we decide to stick a large number of these
glBindBuffer (GL_VERTEX_ARRAY, vbo);
glCheckError();
This will give us the following output:
Debug output
A less common, but more useful tool than
ARB_debug_output or AMD_debug_output extension. Note that OS X does not seem to support debug output functionality (as gathered online).
In order to start using debug output we have to request a debug output context from OpenGL at our initialization process. This process varies based on whatever windowing system you use; here we will discuss setting it up on GLFW, but you can find info on other systems in the additional resources at the end of the chapter.
Debug output in GLFW
Requesting a debug context in GLFW is surprisingly easy as all we have to do is pass a hint to GLFW that we'd like to have a debug output context. We have to do this before we call
glfwWindowHint (GLFW_OPENGL_DEBUG_CONTEXT, true);
Once we've then initialized GLFW, we should have a debug context if we're using OpenGL version 4.3 or higher. If not, we have to take our chances and hope the system is still able to request a debug context. Otherwise we have to request debug output using its OpenGL extension(s).
To check if we successfully initialized a debug context we can query OpenGL:
int flags; glGetIntegerv(GL_CONTEXT_FLAGS, &flags);
if (flags & GL_CONTEXT_FLAG_DEBUG_BIT)
{
    // initialize debug output
}
The way debug output works is that we pass OpenGL an error logging function callback (similar to GLFW's input callbacks) and in the callback function we are free to process the OpenGL error data as we see fit; in our case we'll be displaying useful error data to the console. Below is the callback function prototype that OpenGL expects for debug output:
void APIENTRY glDebugOutput(GLenum source, GLenum type, unsigned int id, GLenum severity,
                            GLsizei length, const char *message, const void *userParam);
Given the large set of data we have at our exposal, we can create a useful error printing tool like below:
void APIENTRY glDebugOutput(GLenum source,
                            GLenum type,
                            unsigned int id,
                            GLenum severity,
                            GLsizei length,
                            const char *message,
                            const void *userParam)
{
    // ignore non-significant error/warning codes
    if(id == 131169 || id == 131185 || id == 131218 || id == 131204) return;

    std::cout << "---------------" << std::endl;
    std::cout << "Debug message (" << id << "): " <<  message << std::endl;

    switch (source)
    {
        case GL_DEBUG_SOURCE_API:             std::cout << "Source: API"; break;
        case GL_DEBUG_SOURCE_WINDOW_SYSTEM:   std::cout << "Source: Window System"; break;
        case GL_DEBUG_SOURCE_SHADER_COMPILER: std::cout << "Source: Shader Compiler"; break;
        case GL_DEBUG_SOURCE_THIRD_PARTY:     std::cout << "Source: Third Party"; break;
        case GL_DEBUG_SOURCE_APPLICATION:     std::cout << "Source: Application"; break;
        case GL_DEBUG_SOURCE_OTHER:           std::cout << "Source: Other"; break;
    } std::cout << std::endl;

    switch (type)
    {
        case GL_DEBUG_TYPE_ERROR:               std::cout << "Type: Error"; break;
        case GL_DEBUG_TYPE_DEPRECATED_BEHAVIOR: std::cout << "Type: Deprecated Behaviour"; break;
        case GL_DEBUG_TYPE_UNDEFINED_BEHAVIOR:  std::cout << "Type: Undefined Behaviour"; break;
        case GL_DEBUG_TYPE_PORTABILITY:         std::cout << "Type: Portability"; break;
        case GL_DEBUG_TYPE_PERFORMANCE:         std::cout << "Type: Performance"; break;
        case GL_DEBUG_TYPE_MARKER:              std::cout << "Type: Marker"; break;
        case GL_DEBUG_TYPE_PUSH_GROUP:          std::cout << "Type: Push Group"; break;
        case GL_DEBUG_TYPE_POP_GROUP:           std::cout << "Type: Pop Group"; break;
        case GL_DEBUG_TYPE_OTHER:               std::cout << "Type: Other"; break;
    } std::cout << std::endl;

    switch (severity)
    {
        case GL_DEBUG_SEVERITY_HIGH:         std::cout << "Severity: high"; break;
        case GL_DEBUG_SEVERITY_MEDIUM:       std::cout << "Severity: medium"; break;
        case GL_DEBUG_SEVERITY_LOW:          std::cout << "Severity: low"; break;
        case GL_DEBUG_SEVERITY_NOTIFICATION: std::cout << "Severity: notification"; break;
    } std::cout << std::endl;
    std::cout << std::endl;
}
Whenever debug output detects an OpenGL error, it will call this callback function and we'll be able to print out a large deal of information regarding the OpenGL error. Note that we ignore a few error codes that tend to not really display anything useful (like 131185 in NVidia drivers that tells us a buffer was successfully created).
Now that we have the callback function it's time to initialize debug output:
if (flags & GL_CONTEXT_FLAG_DEBUG_BIT)
{
glEnable (GL_DEBUG_OUTPUT);
glEnable (GL_DEBUG_OUTPUT_SYNCHRONOUS);
glDebugMessageCallback(glDebugOutput, nullptr);
glDebugMessageControl(GL_DONT_CARE, GL_DONT_CARE, GL_DONT_CARE, 0, nullptr, GL_TRUE);
}
Here we tell OpenGL to enable debug output. The
Filter debug output
With
glDebugMessageControl(GL_DEBUG_SOURCE_API,
                      GL_DEBUG_TYPE_ERROR,
                      GL_DEBUG_SEVERITY_HIGH,
                      0, nullptr, GL_TRUE);
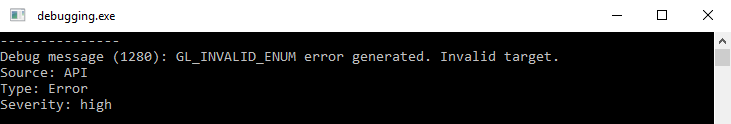
Given our configuration, and assuming you have a context that supports debug output, every incorrect OpenGL command will now print a large bundle of useful data:
Backtracking the debug error source
Another great trick with debug output is that you can relatively easy figure out the exact line or call an error occurred. By setting a breakpoint in
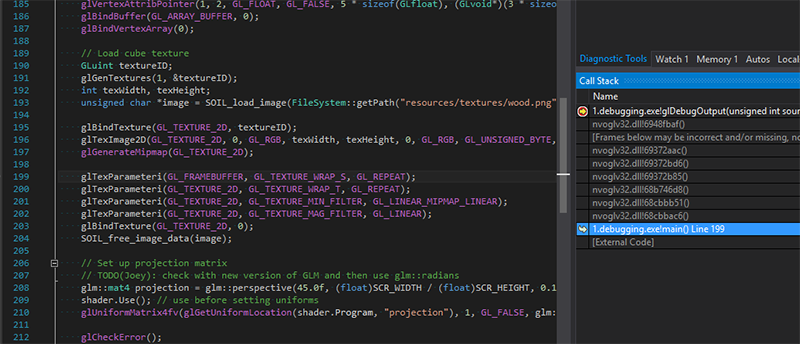
It requires some manual intervention, but if you roughly know what you're looking for it's incredibly useful to quickly determine which call causes an error.
Custom error output
Aside from reading messages, we can also push messages to the debug output system with
glDebugMessageInsert(GL_DEBUG_SOURCE_APPLICATION, GL_DEBUG_TYPE_ERROR, 0,
                     GL_DEBUG_SEVERITY_MEDIUM, -1, "error message here");
This is especially useful if you're hooking into other application or OpenGL code that makes use of a debug output context. Other developers can quickly figure out any reported bug that occurs in your custom OpenGL code.
In summary, debug output (if you can use it) is incredibly useful for quickly catching errors and is well worth the effort in setting up as it saves considerable development time. You can find a source code example here with both
Debugging shader output
When it comes to GLSL, we unfortunately don't have access to a function like
One frequently used trick to figure out what is wrong with a shader is to evaluate all the relevant variables in a shader program by sending them directly to the fragment shader's output channel. By outputting shader variables directly to the output color channels, we can convey interesting information by inspecting the visual results. For instance, let's say we want to check if a model has correct normal vectors. We can pass them (either transformed or untransformed) from the vertex shader to the fragment shader where we'd then output the normals as follows:
#version 330 core
out vec4 FragColor;
in vec3 Normal;
[...]

void main()
{
    [...]
    FragColor.rgb = Normal;
    FragColor.a = 1.0f;
}
By outputting a (non-color) variable to the output color channel like this we can quickly inspect if the variable is, as far as you can tell, displaying correct values. If, for instance, the visual result is completely black it is clear the normal vectors aren't correctly passed to the shaders; and when they are displayed it's relatively easy to check if they're (sort of) correct or not:
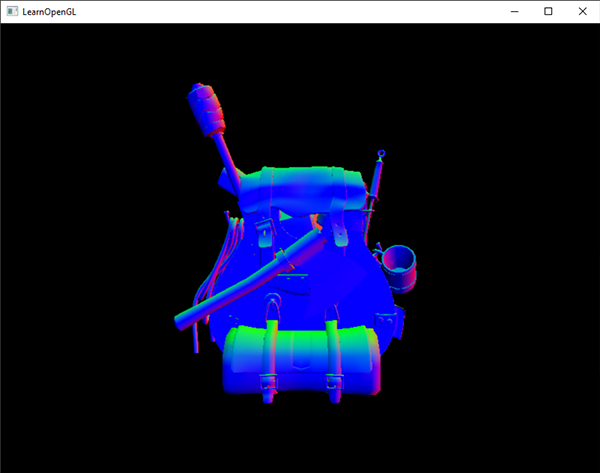
From the visual results we can see the world-space normal vectors appear to be correct as the right sides of the backpack model is mostly colored red (which would mean the normals roughly point (correctly) towards the positive x axis). Similarly, the front side of the backpack is mostly colored towards the positive z axis (blue).
This approach can easily extend to any type of variable you'd like to test. Whenever you get stuck and suspect there's something wrong with your shaders, try displaying multiple variables and/or intermediate results to see at which part of the algorithm something's missing or seemingly incorrect.
OpenGL GLSL reference compiler
Each driver has its own quirks and tidbits; for instance, NVIDIA drivers are more flexible and tend to overlook some restrictions on the specification, while ATI/AMD drivers tend to better enforce the OpenGL specification (which is the better approach in my opinion). The result of this is that shaders on one machine may not work on the other due to driver differences.
With years of experience you'll eventually get to learn the minor differences between GPU vendors, but if you want to be sure your shader code runs on all kinds of machines you can directly check your shader code against the official specification using OpenGL's GLSL reference compiler. You can download the so called
Given the binary GLSL lang validator you can easily check your shader code by passing it as the binary's first argument. Keep in mind that the GLSL lang validator determines the type of shader by a list of fixed extensions:
.vert: vertex shader..frag: fragment shader..geom: geometry shader..tesc: tessellation control shader..tese: tessellation evaluation shader..comp: compute shader.
Running the GLSL reference compiler is as simple as:
glsllangvalidator shaderFile.vert
Note that if it detects no error, it returns no output. Testing the GLSL reference compiler on a broken vertex shader gives the following output:
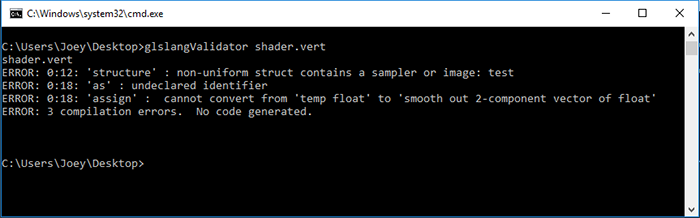
It won't show you the subtle differences between AMD, NVidia, or Intel GLSL compilers, nor will it help you completely bug proof your shaders, but it does at least help you to check your shaders against the direct GLSL specification.
Framebuffer output
Another useful trick for your debugging toolkit is displaying a framebuffer's content(s) in some pre-defined region of your screen. You're likely to use framebuffers quite often and, as most of their magic happens behind the scenes, it's sometimes difficult to figure out what's going on. Displaying the content(s) of a framebuffer on your screen is a useful trick to quickly see if things look correct.
Using a simple shader that only displays a texture, we can easily write a small helper function to quickly display any texture at the top-right of the screen:
// vertex shader
#version 330 core
layout (location = 0) in vec2 position;
layout (location = 1) in vec2 texCoords;

out vec2 TexCoords;

void main()
{
    gl_Position = vec4(position, 0.0f, 1.0f);
    TexCoords = texCoords;
}

// fragment shader
#version 330 core
out vec4 FragColor;
in  vec2 TexCoords;

uniform sampler2D fboAttachment;

void main()
{
    FragColor = texture(fboAttachment, TexCoords);
}
void DisplayFramebufferTexture(unsigned int textureID)
{
if (!notInitialized)
{
// initialize shader and vao w/ NDC vertex coordinates at top-right of the screen
[...]
}
glActiveTexture (GL_TEXTURE0);
glUseProgram (shaderDisplayFBOOutput);
glBindTexture (GL_TEXTURE_2D, textureID);
glBindVertexArray (vaoDebugTexturedRect);
glDrawArrays (GL_TRIANGLES, 0, 6);
glBindVertexArray (0);
glUseProgram (0);
}
int main()
{
[...]
while (!glfwWindowShouldClose (window))
{
[...]
DisplayFramebufferTexture(fboAttachment0);
glfwSwapBuffers (window);
}
}
This will give you a nice little window at the corner of your screen for debugging framebuffer output. Useful, for example, for determining if the normal vectors of the geometry pass in a deferred renderer look correct:
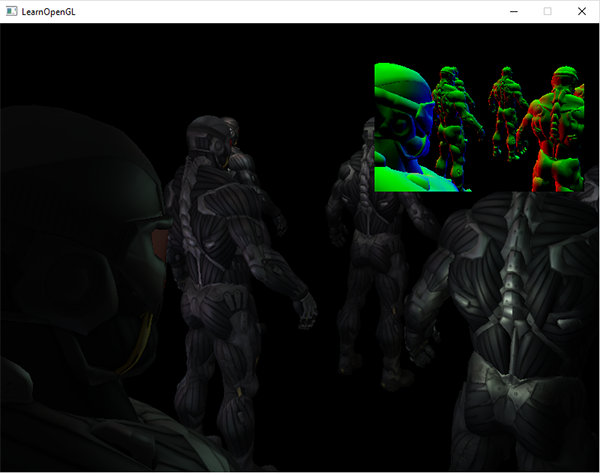
You can of course extend such a utility function to support rendering more than one texture. This is a quick and dirty way to get continuous feedback from whatever is in your framebuffer(s).
External debugging software
When all else fails there is still the option to use a 3rd party tool to help us in our debugging efforts. Third party applications often inject themselves in the OpenGL drivers and are able to intercept all kinds of OpenGL calls to give you a large array of interesting data. These tools can help you in all kinds of ways like: profiling OpenGL function usage, finding bottlenecks, inspecting buffer memory, and displaying textures and framebuffer attachments. When you're working on (large) production code, these kinds of tools can become invaluable in your development process.
I've listed some of the more popular debugging tools here; try out several of them to see which fits your needs the best.
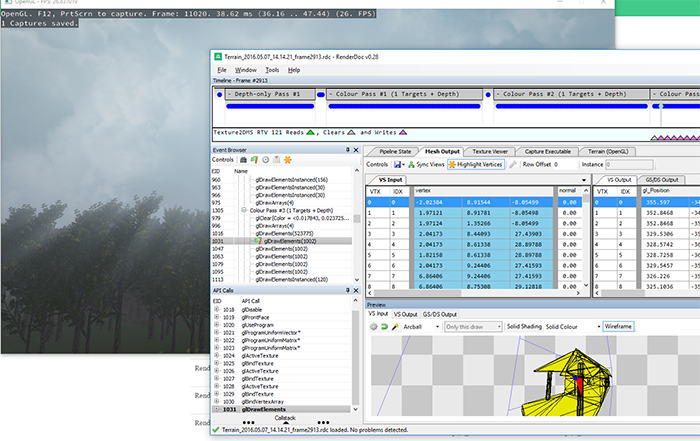
RenderDoc
RenderDoc is a great (completely open source) standalone debugging tool. To start a capture, you specify the executable you'd like to capture and a working directory. The application then runs as usual, and whenever you want to inspect a particular frame, you let RenderDoc capture one or more frames at the executable's current state. Within the captured frame(s) you can view the pipeline state, all OpenGL commands, buffer storage, and textures in use.
CodeXL
CodeXL is GPU debugging tool released as both a standalone tool and a Visual Studio plugin. CodeXL gives a good set of information and is great for profiling graphics applications. CodeXL also works on NVidia or Intel cards, but without support for OpenCL debugging.
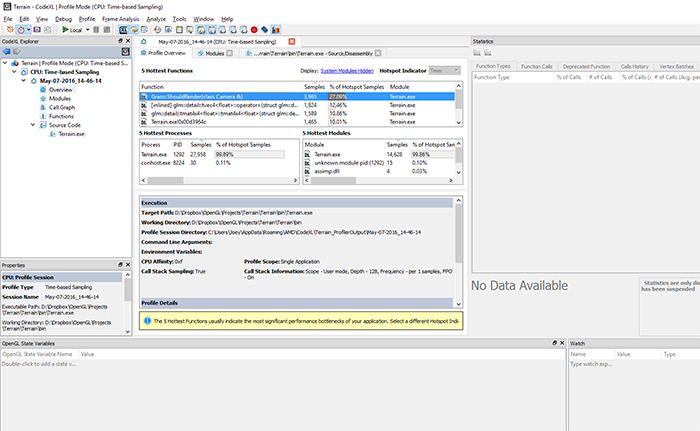
I personally don't have much experience with CodeXL since I found RenderDoc easier to use, but I've included it anyways as it looks to be a pretty solid tool and developed by one of the larger GPU manufacturers.
NVIDIA Nsight
NVIDIA's popular Nsight GPU debugging tool is not a standalone tool, but a plugin to either the Visual Studio IDE or the Eclipse IDE (NVIDIA now has a standalone version as well). The Nsight plugin is an incredibly useful tool for graphics developers as it gives a large host of run-time statistics regarding GPU usage and the frame-by-frame GPU state.
The moment you start your application from within Visual Studio (or Eclipse), using Nsight's debugging or profiling commands, Nsight will run within the application itself. The great thing about Nsight is that it renders an overlay GUI system from within your application that you can use to gather all kinds of interesting information about your application, both at run-time and during frame-by-frame analysis.
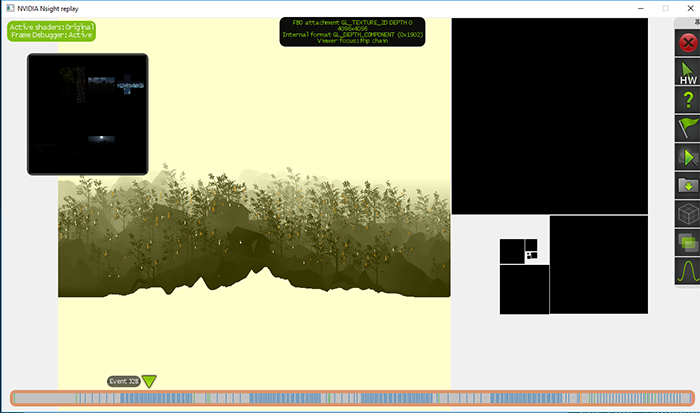
Nsight is an incredibly useful tool, but it does come with one major drawback in that it only works on NVIDIA cards. If you are working on NVIDIA cards (and use Visual Studio) it's definitely worth a shot.
I'm sure there's plenty of other debugging tools I've missed (some that come to mind are Valve's VOGL and APItrace), but I feel this list should already get you plenty of tools to experiment with.
Additional resources
- Why is your code producing a black window: list of general causes by Reto Koradi of why your screen may not be producing any output.
- Debug Output in OpenGL: an extensive debug output write-up by Vallentin with detailed information on setting up a debug context on multiple windowing systems.